As Cattaraugus County entered into the COVID shutdown, EDPT reached out to County businesses and restaurants to hear their concerns and help us prepare for their needs.
Take-Out/Delivery Restaurants
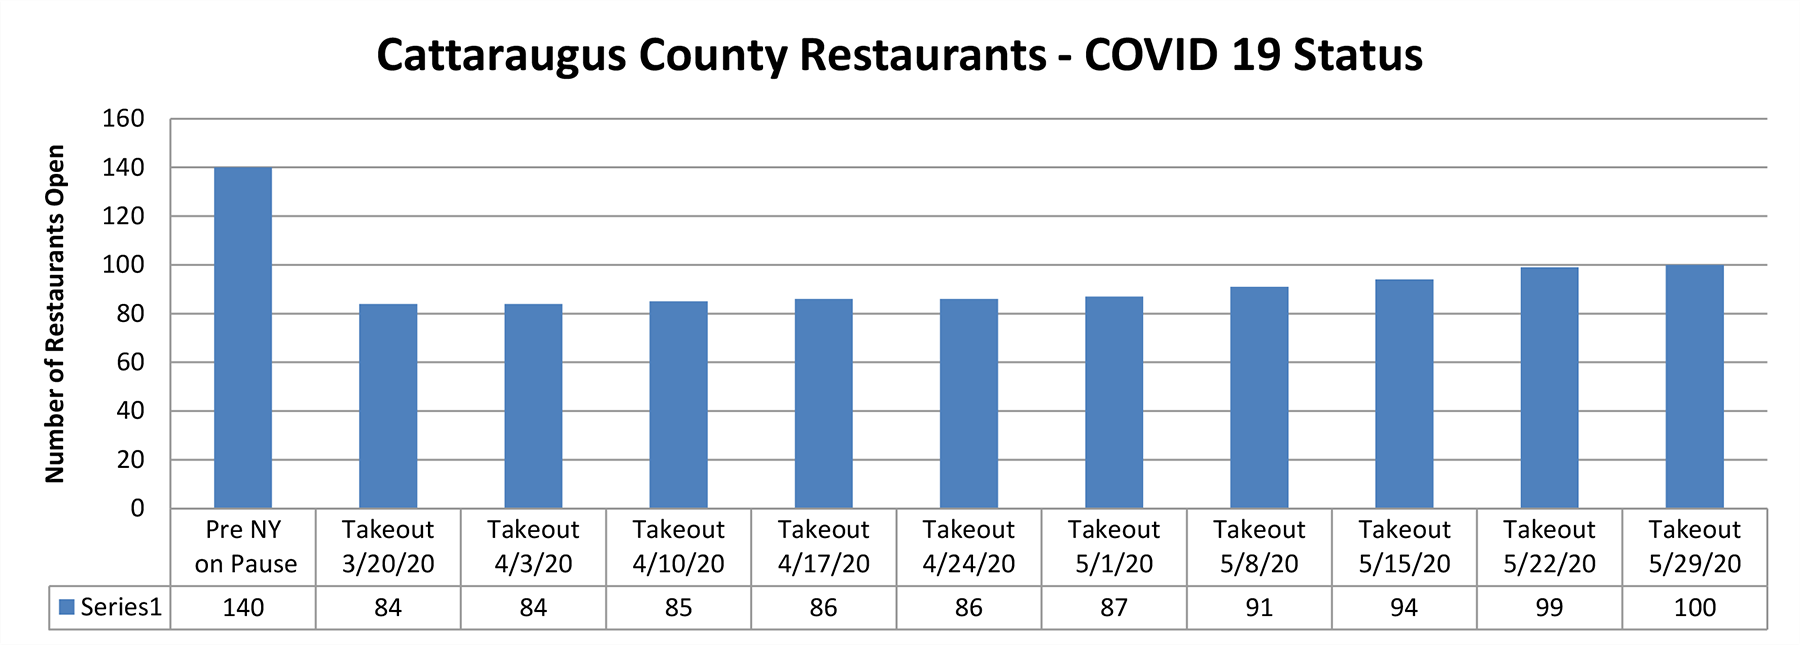
With changes happening so frequently, we created a place for restaurants to post their hours and offerings. Since March, we have seen a steady increase in the number of restaurants offering take-out, and residents have been faithfully patronizing them. The chart below marks our progress toward full reopening of restaurants. We now have 100 restaurants open for take-out food.
| Date | Restaurants Open for Take-Out |
|---|---|
| February 2020 | 140 |
| March 20, 2020 | 84 |
| April 3, 2020 | 84 |
| April 10, 2020 | 85 |
| April 17, 2020 | 86 |
| April 24, 2020 | 86 |
| May 1, 2020 | 87 |
| May 8, 2020 | 91 |
| May 15, 2020 | 94 |
| May 22, 2020 | 99 |
| May 29, 2020 | 100 |
Unemployment Rate
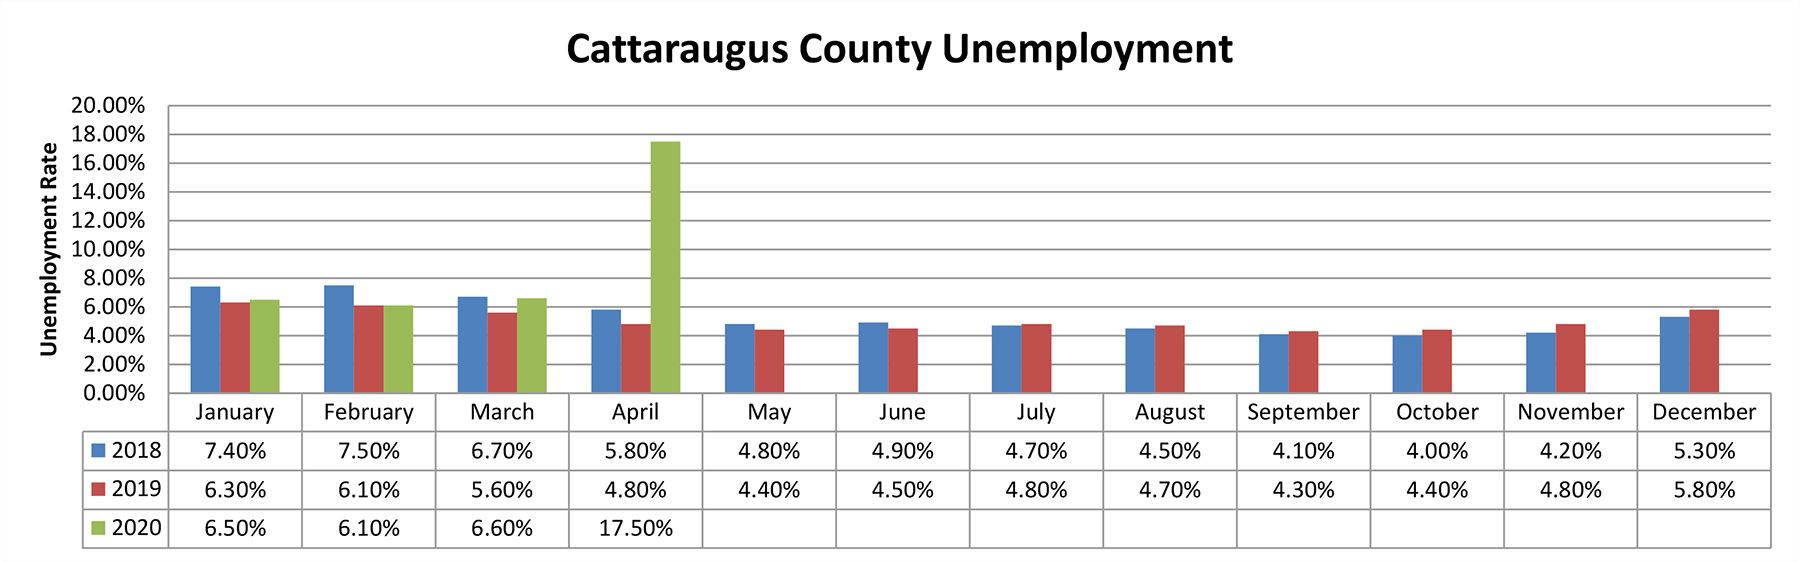
Cattaraugus County’s unemployment rate jumped to 17.5% in April, a strong indicator on how the COVID-19 pandemic has impacted the County’s workforce. The unemployment rate nearly tripled from March, however the March surveys were completed before many of the closures were implemented.
| Month | Year: 2018 | Year: 2019 | Year: 2020 |
|---|---|---|---|
| January | 7.40% | 6.30% | 6.50% |
| February | 7.50% | 6.10% | 6.10% |
| March | 6.70% | 5.60% | 6.60% |
| April | 5.80% | 4.80% | 17.50% |
| May | 4.80% | 4.40% | |
| June | 4.90% | 4.50% | |
| July | 4.70% | 4.80% | |
| August | 4.50% | 4.70% | |
| September | 4.10% | 4.30% | |
| October | 4.00% | 4.40% | |
| November | 4.20% | 4.80% | |
| December | 5.30% | 5.80% |